Monday, March 21, 2022

How many towers can you build such that a layer cannot have more blocks than the last one?

 Or in mathematical words:

How many possible combinations for $1 \le i_1 \le ... \le i_k \le n $?

This week's problem was inspired by a simple question from my discrete mathematics class. The original question the teacher asked was:

\[a_n = |(i_1,...,i_k) \in \mathbb{Z}^k :1 \le i_1 < ...<i_k \le n| \]

The answer to this question is $\binom{n}{k}$ since we are picking k many different numbers smaller than n. Afterwards a simple question came to my mind. What's $b_n$ such that:

\[b_n = |(i_1,...,i_k) \in \mathbb{Z}^k :1 \le i_1 \le ... \le i_k \le n| \]

The Visualization

If these notations seem a bit confusing there is another way to ask these questions. Let's say $a_n$ is the number of possible buildings with k many floors such that every floor  has at least 1 and at most n rooms and such that a floor must have less rooms than the one below it. And $b_n$ is the number of possible buildings with k many floors such that every floor  has at least 1 and at most n rooms and such that a floor can have at most as many rooms as the one below it.  So, $a_n$ is the number of possible card towers while $b_n$ is the possible towers built using small building blocks.You can visualize the possible buildings for $b_2$ where k=3 as:


The Initial Instinct

When you look at this question, it looks simple enough but if you try to fight it head on you'll realize that it gets very complicated. 

Let's try to calculate the number of possibilities such that there are no equal pairs. The answer is  $\binom{n}{k}$ like we did earlier.

Then it's time to calculate the number of possibilities such that there is only 1 pair of equal numbers. So we'll pick $\binom{n}{k-1}$ many different numbers and then, we'll pick one number to be the equal pair. So the answer for this sub question is $\binom{n}{k} \times \binom{k-1}{1}$. Seems easy enough.

But when we have to calculate other possibilities such as where there are 2 distinct pairs, where there 3 of the $i$'s which have the same value, where 3 of the i's have the same value and there is an extra pair etc etc it becomes a very long equation. While working on it, I asked my good friend Nevzat Akkaya if he had any ideas. He came up with a pretty elegant idea. So the credit goes to him.

The Solution

We know that there are $k-1$ many signs between the $i$'s when we try to order them. So instead of trying to calculate a formula where we decide how many $i$'s are gonna be equal, we decide how many signs will be "=" and how many of them will be "<". But in order to prove the question this way, first, we have to see:

-If we have n many numbers and we order them using only "<" and "=", then there is only one possible ordering. 

Well this is clear due to $\mathbb{Z}$ being a well ordered set.

Now let's say we have $x$ many distinct  numbers. Then we must have $x-1$ "<" signs and subsequently $(k-1)-(x-1)=k-x$ many "=" signs. How many orderings of these sign are possible? Well the answer is: $\frac{(k-1)!}{(x-1)! \times (k-x)!}$. 

When we have an ordering of signs, there is only 1 possible way to fill the slots up since there are $x-1$ many "<" signs and x many distinct numbers. The slots between the "=" signs already fill themselves up. 

We are assuming that $n \geq k$ (if not just let $\binom{n}{k}$s where $k >n$, equal to zero). Then the answer is:

 \[ \binom{n}{1} \times \frac{(k-1)!}{(1-1)! \times  (k-1)!} + \binom{n}{2} \times \frac{(k-1)!}{(2-1)! \times (k-2)!} + ... + \binom{n}{k} \times \frac{(k-1)!}{(k-1)! \times (k-k)!} \]

 \[= \sum_{i=1}^{k} \binom{n}{i} \frac{(k-1)!}{(i-1)! \times (k-i)!} \] 

We finially get the answer:

\[ \sum_{i=1}^{k} \binom{n}{i} \binom{k-1}{i-1}  \]


Sunday, March 6, 2022

Biggest k such that n over k is less than or equal to n!

Let's find the biggest k such that $n^k \le n! $

In an introductory class for the induction method, one of the common examples given by the teachers is "prove that $n^n \ge n!$". This problem is intuitive since both of the sides are calculated doing n different multiplications while in $n!$ the multipliers are generally less than n. 

While the teacher was proving this in the whiteboard, I came up with a simple question: What is the biggest possible value for k such that $n^k \le n! $. At first I wanted k and n to be an integers but the question can be solved in a similar manner if k is a positive real number. You should try to solve it on your own but here's my solution:

Take the logarithm of both sides with your favorite base:

\[\ln{n^k} \le \ln{n!} \]

\[k \, \ln{n} \le \ln{n} +\ln{n-1}+....+ \ln{2} + \ln{1} \]

\[ k \le \frac{ \ln{n} +\ln{n-1}+....+ \ln{2} + \ln{1} }{\ln{n}} \]

Round k to the biggest possible integer such that this holds.

As you can see when we plot the numbers it's a pretty linear graph but when we look at the ratio between n and k the graph changes:

And when we look at the limit using wolframalpha, just like you can see from the graph, n/k converges to 1.

You can find this sequence in OEIS with the code number A039960.


Sunday, February 27, 2022

Partitions and OEIS: On-Line Encyclopedia of Integer Sequences

 For this term I decided to take a non-credit lesson called Experimental Mathematics and in this course I've found out about an amazing tool called OEIS. OEIS stands for On-Line Encyclopedia of Integer Sequences. 

Basically it's an extensive list of interesting sequences. If you come across any sequence in your studies, you don't have to hit your head against a wall hoping to figure out the pattern. You just go to here and type it. If there exists a pattern in that sequence this site will probably tell you. For any sequence you type, you can find previous work done on that sequence.

I cannot express how excited I am to have met this tool. A big part of my time this week was spent trying to find new patterns or looking up already existing sequences and reading about their other properties.

Here are some interesting sequences:

    1, 101, 1001, 10001, 100001, 112233, 10000001, 100122, 1000011...

Can you see the pattern? If not, worry not, just type it into OEIS.

This is the sequence of smallest number whose digits can be permuted to get exactly n distinct palindromes.

    1, 0, 0, 1, 0, 1, 0, 1, 1, 1, 0, 2, 0, 1, 1, 3, 0, 2, 0, 2, 1, 1, 0, 4, 1, 1, 1, 2, 0, 3, 0, 3, 1, 1, 1, 5, 0, 1, 1, 4...

Does this even have a pattern? Well yes it does, it is the number of even length factorizations of n into factors greater than one.

    7, 13, 19, 23, 31, 79, 97, 103, 109, 139, 167, 193, 239

Well these are clearly prime but what kind of prime? They are happy :) primes!  Happy prime is a prime that eventually reaches 1 under iteration of "x -> sum of squares of digits of x".

You get the point. This is an extremely strong tool for those who like to mess around with numbers. The thing I messed around with most this week was partitions.

Integer Partitions

 Partition is a collection of ways to sum positive numbers to get n. For example the partitions of 4 are:

4=4    4=3+1    4=2+2    4=2+1+1    4=1+1+1+1

Can you think of a function that gives the numbers of partitions of n? Here are the first 15 integers:


My initial instinct to approach this problem was incorrect. I had thought that 

$f_1$(n)=[ $f_1$(n-1) $f_1$(1) + $f_1$(n-2) $f_1$(2) +...+ $f_1$(1) $f_1$(n-1) ] / 2

This idea stemmed from the fact that a partition consisted of smaller partitions. But as you can clearly see you were counting some partitions way too many times. Plus, sometimes in even numbers you would get non-integer results.

During the lesson, we learned how to approach this kinda problem. If you are curious you can check it out here. But my mind got stuck on a question "Can I just substract some function from $f_1$ in order to get the result I want?" How many times am I counting the extra partitions? I changed the function a bit in order fix the even/odd problem. Then, I looked at the difference between the actual numbers of partitions vs $f_1$:


 It looked proportional to the true partition function. So maybe I could get an answer from here. $f_1$'s result were:

[1, 2, 7, 11, 26, 40, 83, 120, 223, 320, 566, 784, 1310, 1802, 2922]

while the true results were:

[2, 3, 5, 7, 11, 15, 22, 30, 42, 56, 77, 101, 135, 176]

 I've searched OEIS for "1, 2, 7, 11, 26, 40, 83, 120, 223, 320, 566" but unfortunately there wasn't a previously worked on pattern. 

Then what happened was me trying many different ways to calculate what to substract. In the end I failed. I couldn't find a proper function to substract. Well that's just mathematics, you can't solve everything yourself. Maybe I'll be able to solve it in a few years, maybe not. 

If you have any idea on how to solve this problem please mail me. I would be extremely happy.

Saturday, February 19, 2022

Farkle Kingdom Come Deliverance Best Strategy (Dice Games Chapter 2)

Farkle is a simple dice game in the video game Kingdom Come Deliverance. The aim is to reach 4000 points and the gameplay is kinda similar to dice blackjack. You start with 6 dice and you throw them. Certain dice have scoring value so you can put them aside and throw the rest of the dice again in hopes of scoring more points but if you don't get any scoring dice, you bust, i.e. "farkle". So it is smart to bank your points when you have too few dice left. Since farkle is an old game the scoring varies a lot. I decided to use the rules from the game Kingdom Come Deliverance. Here is the scoring:

-a single 1: 100 points

-a single 5: 50 points

-three of a kind: 100 points multiplied by the given number

-three 1's: 1000 points

-four or more of a kind: Double the points of three of a kind

-full straight 1 to 6: 1500 points

-partial straight 1 to 5: 500 points

-partial straight 2 to 6: 750 points

You can combine these scorings. So for example, if you were to get {1,1,2,2,2,4}, the two 1's would be worth $100+100=200$ points and three of a kind 2's would be worth $2 \times 100=200$ points. Then when you set aside the scoring dice, only one die is left. You can either choose to bank the 400 points or roll again with only one die. Let's say we were to roll it again. If that die was a 1 or a 5, i.e. a scoring die, when we set it aside we would get all the 6 dice back since there were no dice left. So we would roll again until we bank or farkle.

My Solution

Now that we've learned about the game, it's time to find the best strategy and then test it. But since some parts of the game are too complex, I decided to make life easy for myself.  You are always welcome to build upon my calculations. Maybe I'll make another post considering what I've left behind.

First of all, the strategy doesn't count in what the opponent's score is. Of course it makes more sense to roll once again when the opponent is 50 points away from winning. In my game the only aim is to get to 4000 in the least amount of turns. I don't think that this is that big of a sacrifice and can easily be adjusted after I calculate the best strategy.

Here is the biggest compromise I had to make in order to solve the problem: In the real game you can pick which scoring dice you will set aside but in my game you have to set aside all the scoring dice. If your first throw were {1,5,2,2,3,3} you cannot just set aside the 1 and throw remaining five dice, you have to set aside 1 and 5, then throw the remaining four dice. After all I am not trying to create an unbeatable AI, I am just trying to find a strategy that can guide people while playing the game. 

This seems easy enough

My first instinct was to just calculate the expected value for a $n$ dice throw like I did in my blackjack game. Expected value, intuitively, is the average score you get when you play the game infinitely many times.  The formal definition is:

Let $X$ be the finite list of all possible outcomes $\{x_1, x_2,...,x_n\}$ where all outcomes respectively have the probability $\{p_1, p_2,...,p_n\}$. Then the expected value is defined as 

\[E[X]=x_1 p_1 + x_2 p_2 + ... + x_n p_n\]

If you want more more information on the expected value click here or here

It was impossible for me to calculate the expected value given a dice throw by hand since there were so many possibilities.  So I wrote a small program which calculated it for me. Basically a function took the average of all possible points for an $n$ dice throw. Here are the results:

Expected value of an $n$ Dice Throw

So for example if you were to throw three dice over and over again the average score you got on your throw would be approximately 93.75. Then I, and by "I" I mean the computer, calculated the possibility of a bust given a dice throw. Here are the results:

Probability of a Bust of an $n$ Dice Throw

After these findings my strategy was ready: Let's say you want to decide whether to bank your accumulated points or roll $n$ dice. If your points are more than what we expect to gain from the throw, then we should bank; roll otherwise. Let $P$ denote our points, $B$ our bust possibility and naturally $1-B$ our non bust possibility. Here is how we calculate when to throw:

\[P< (P+E) \times (1-B) + 0 \times B \]

\[P< P + E -BP -EB\]

\[BP< E \times (1-B)\]

\[P< \frac{E \times (1-B)}{B} \]

Then we got this graph:

WRONG Strategy

Can you see where I went wrong? When I looked at this graph, I felt confused. It was clearly wrong. Then it hit me. 

My expected values were wrong. Your 1 die throw's expected value has to be higher than 25 since if you roll a 5 or 1, you'll get back your 6 dice (and with those 6 dice the expected value is at least 487.).  But the framework was ready, all I had to do was to just calculate the true expected values, right?

Okay maybe this is difficult.

I started to see everything difficult about calculating the expected value. The amount of remaining dice changed so I couldn't just multiply everything with a non-bust probability. Worst of all it was recursive. I had to know the expected value of 6 in order to calculate the expected value of 1 and in order the calculate the expected value of 6 I had to know the expected value of 1! The game had the potential to take an almost infinitely long time. If this game had less amount of possibilities  I probably would be able to calculate it with pen and paper but there were just too many possibilities. I was about to give up, it was clear that I didn't know enough probability to solve this question. 

Then I had a second revelation. I didn't have to be exact. I just wanted to create a chart that people could look at in order to decide whether to roll or not. Do you remember the intuitive definition of an expected value? I was just going to simulate the game 1,000,000 times with different amount of dice in order to calculate the approximate expected values. Thank god for computers, coming to my rescue when I can't solve a question on my own. Here are the approximate expected values:

Approximate Expected Values

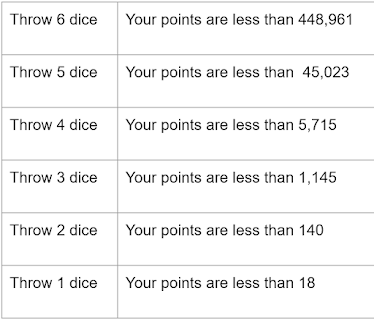
So here is your cheat sheet while playing the game Farkle in Kingdom Come Deliverance:

The Correct Strategy

Of course this game is much more than this. I just tried to make a simple mathematical guide. After I take a probability course, I'll probably try to calculate the real expected value but for now this is good enough. Have fun playing.


Friday, February 11, 2022

Blackjack Using Dice (Dice Games Chapter 1)

I'm starting a new series called "Dice Games". In this series, I'll make up a bunch of dice games/experiments. Then I'll try to calculate what'll happen using probability. In the end Monte Carlo method will decide if I was correct or not. If you don't know what Monte Carlo method is, it's basically a computer simulating the experiments using random inputs many times. 

Let's start with the first game:

BLACKJACK USING DICE

The objective of this game is simple, get as close to 21 as you can but don't surpass it. You'll start with a random 2 dice roll, then you can hit (roll a die and add it to your score) or pass (keep your score). To make it simple, I will ignore the dealer aspect of this game for now. I'm just trying to find the best winning strategy. Where should you stop? Any guesses?

My Solution

Expected value is the average outcome if you were to roll a die a gazillion times. And it's defined as:  

Let $X$ be the finite list of all possible outcomes $\{x_1, x_2,...,x_n\}$ where all outcomes respectively have the probability $\{p_1, p_2,...,p_n\}$. Then the expected value is defined as 

\[E[X]=x_1 p_1 + x_2 p_2 + ... + x_n p_n\]

So for example let's calculate the expected value of a die. The list of all outcomes is $\{1,2,3,4,5,6\}$ with each of them having a probability of $\frac{1}{6}$. Then the expected value is 

\[E[\textrm{dice}]= 1 \times \frac{1}{6}+2 \times \frac{1}{6}+3 \times \frac{1}{6}+4 \times \frac{1}{6}+5 \times \frac{1}{6}+6 \times \frac{1}{6} = \frac{7}{2}=3.5 \]

This means that if you had infinite time to roll a die and to write the outcome  onto a paper, the average of your results be $3.5$. This makes sense right? So my winning strategy is: 

Hit if your score is less than $17.5$, pass otherwise.

 To see if this is a valid strategy I'll make my strategy play against these strategies:

1-Hit if your score is less than $15.5$, pass otherwise.

2-Hit if your score is less than $16.5$, pass otherwise.

3-Hit if your score is less than $18.5$, pass otherwise.

4-Hit if your score is less than $19.5$, pass otherwise.

5- Hit if your score is less than $20.5$, pass otherwise.

Let's Simulate it

The ones with the biggest score less than 21 gets +1 point. They all get the same dice rolls so I think it's a fair game. Here are the results over 100,000 games:


As you can see $17.5$ was indeed the correct strategy with $18.5$ coming close. I've also included their average winning scores and average overall scores for those who like looking at data:

Blue is the average winning score, red is the average score throughout the games.

 Also here are how many times each strategy has busted:


 So if we were to implement "blackjack using dice" game to a casino, we know what our strategy should be. But what if a dealer was involved? So you would win money if the dealer was bust but we wouldn't know what their first card was while hitting. Also, other player's scores wouldn't affect us.  In blackjack the dealer has 16.5 as their stopping point (so 17 and higher means stop). But this is not really realistic since it means that the dealer can almost never bust (only possibility is 16+6). So in order to make our game more like blackjack, where should the dealer stop?

I will explore these questions in the upcoming weeks when I have time.


Edit: Thanks to reddit user u/PrestigiousCoach4479 I saw a mistake that I've made. The fact that my strategy won while competing with those 5 strategies didn't mean that it would beat each strategy in 1v1. It wasn't transitive. As the user put it: "Your method for evaluating strategies is intransitive in general. You might have A beat B which beats C which beats A heads-up, and in a field of 4 strategies, D which loses to the first three heads-up might be first out of 4. Including a strategy that loses to the other strategies, and comes in last, might change which strategy wins." 

So let's test that. Thankfully my code was clean so it took only two minutes to configure it. Here are the results! 

Note: Since 17.5's and 18.5's scores were very close, I made them play 50000000 games instead of 100000 games. They were still very close!


Alas 17.5 still won...

Thursday, February 3, 2022

Proving the Perimeter of a Circle


What is the perimeter of a circle? This is a very easy question right? $2 \pi r$ of course. Well why? This was the simple question that bothered my mind last weekend. I thought of some proofs myself and made many mistakes along the way.

It seemed like a simple integral: $ \int_0^{2 \pi} \! r \, \mathrm{d} \theta $. Since $d \theta \times r$ gives us the arc length, taking the integral from $0$ to $2 \pi$ (basically making a full turn) gave us the perimeter. The problem with this solution was that it felt like cheating! How did I even know the arc length? 

My next idea was pretty straight forward as well. Firstly I defined a simple sequence: let $x_n$ be the perimeter of an n-sided regular convex shape circumscribed in a circle of radius $r$. So for example:
 
 
Then clearly as n goes to infinity, we would get the perimeter of the circle. So all that was left to do was to find the formula and take the limit. 


Since the sum of all outer angles in a convex shape equals $2 \pi$ and since this shape is regular, $2 \theta= \pi - \frac{2 \pi}{n}$. Then one side of the polygon is $2 \times r \times cos(\theta)$.
Thus, the perimeter of $x_n$ circumscribed in a circle is: 
\[x_n = n \times 2 \times r \times cos(\theta)\]
\[ x_n = n \times 2 \times r \times cos(\frac{ \pi - \frac{2 \pi}{n}}{2}) \]
 
 
\[\lim_{n \to  \infty} x_n = \lim_{n \to \infty} \left[ n  \times 2 \times r \times cos(\frac{ \pi - \frac{2 \pi}{n}}{2}) \right] \]
\[ \lim_{n \to  \infty} x_n= 2 \times r \times  \lim_{n \to \infty} \left[ n  \times cos(\frac{ \pi - \frac{2 \pi}{n}}{2}) \right] \]
Let's solve the limit:
\[\lim_{n \to \infty} \left[ n \times cos(\frac{ \pi - \frac{2 \pi}{n}}{2}) \right] = \lim_{n \to \infty} \left[ n \times cos(\frac{\pi}{2} - \frac{\pi}{n}) \right]  \]
\[= \lim_{n \to \infty} \left[ n \times sin(\frac{\pi}{n}) \right]= \lim_{n \to \infty} \left[ \frac{sin(\frac{\pi}{n})}{\frac{1}{n}} \right]  \]
\[\stackrel{L'H}{=}\lim_{n \to \infty} \left[ \frac{cos(\frac{\pi}{n})\times (-\frac{\pi}{n^2})}{-\frac{1}{n^2}}  \right] = \pi \times \lim_{x \to \infty} cos(\frac{\pi}{n})= \pi\]
Then finally we find the perimeter of a circle: $2 \pi r$. We could have proved the perimeter of a circle in a similar manner, this time defining $x_n$ as the perimeter of an n-sided regular convex shape inscribed in a circle of radius $r$.
 
This proof didn't satisfy me as well but I didn't exactly know why. Using trigonometric functions felt like cheating, since, their intuition came to me from a circle. These trigonometric functions probably already used the perimeter formula in some way. I was using the thing that I wanted to prove as an hypothesis. 
 
I got annoyed.  The perimeter formula had $\pi$ in it! How was I supposed to find $\pi$ without using trigonometric functions or radians (which were already based on the perimeter of a circle)? Then it suddenly hit me! I had forgotten one of the sacred rules of mathematics, I had ignored the definitions.My stupid mistake hit me in the face:
 
\[  \pi = \frac{\textrm{perimeter}}{\textrm{diameter}}\]
 
OF COURSE THE PERIMETER WAS $2 \pi r$! It was in the definition. There was nothing to prove. 
 
But I didn't want to come out with my hands empty. Since $\pi$ was just a ratio, I wanted to prove that this ratio was constant and didn't depend on the radius. This is where my  sequence came in handy! If we have two different circles, their $x_n$ ratios will equal to their radius ratios. In other words, the ratio of their perimeters will equal the ratio of their radiuses. Thus there really is a fixed ratio between the perimeter and the diameter, independent of the length of the radius. 
 
And we call this ratio $\pi$!
 
PS. I'm guessing that cosine function kind of depends on this ratio being fixed so I am probably just repeating my mistake. This problem will stay in my mind and you can expect to see a new blog posts when I have some answers.


Tuesday, January 25, 2022

Differences between sup / inf and lim sup / lim inf

Students who took the Calculus class like me will learn about two very similar concepts: the sup / inf of a sequence and the lim sup / lim inf of a sequence. While these two terms are very similar there are some fundamental differences between them. My friend asked my why they are not equal so I decided to write this blog post. Let's start by giving the formal definitions, then I will try to give an intuitive explanation as to why they are different.


The definitions for the supremum and the infimum use the terms upper bound and lower bound. Let S be a nonempty subset of $\mathbb{R}$, 

$u$ is called an upper bound of S if $ \forall x \in S $ $ u \ge x $. 

The set of all upper bounds is denoted by $ U_S $. And similarly, 

$l$ is called an lower bound of S if $ \forall x \in S $ $ l \le x $. 

The set of all lower bounds is denoted by $ L_S $.

For example if you have the set [0,1] then 10 is an upper bound since 10 is bigger than any number between 0 and 1. 1 is also an upper bound since it is bigger or equal to any number between 0 and 1.


A real number M is called the least upper bound of S or the supremum of S or just simply sup S if:

$M \in U_S$ and $\forall u \in U_S$ $M \le u$

A real number m is called the greatest lower bound of S or the infimum of S or just simply inf S if:

$m \in L_S$ and $\forall l \in L_S$ $m \ge l$ 

Like in the above example both 10 and 1 are upper bounds, but only 1 is the supremum since it is the smallest upper bound. 


Let ${x_n}$ be a sequence in $\mathbb{R}$. We define,

 \[ \text{lim sup }x_n := lim_{N \rightarrow \infty} sup\{x_n : n>N\} \]

 \[ \text{lim inf }x_n := lim_{N \rightarrow \infty} inf\{x_n : n>N\} \]

Intuitively  you can think this as dismissing the first terms of the sequence and just looking at the supremum in the most right side of the graph. The difference between them is that lim sup $x_n$ can be smaller than the supremum. The best example that I can give to this is:

\[ x_n := \begin{cases} 100 & n=1 \\ 1 & n \ne 1 \end{cases} \]


sup $x_n=100$ while lim sup $x_n$=1 


Another difference between them is that if $x_n$ converges, then lim sup $x_n$ = lim inf $x_n$. Of course we can prove this formally but that proof already exists in textbooks. I want to give an intuitive reason why for this. Think of

\[ y_n :=  \begin{cases} \frac{1}{n} & n \text{ is even} \\ -\frac{1}{n} & n \text{ is odd} \end{cases} \]


sup $y_n=1$, inf $y_n=-1$ but lim sup $x_n$ = lim inf $x_n$= lim $x_n$ =0. As you can see from the graph, when we look at the right side, all of the values get invisibly close to zero, so among these numbers the supremum and infimum is zero.


Of course my intuitive explanation might make mathematicians want to pull their hair out but in my opinion even if they help one person, it is good to have explanations like these.


Note: The graphs were drawn by me so they are not precise. You get the point. If this post helped you understand something feel free to comment, it would certainly make my day.


How many towers can you build such that a layer cannot have more blocks than the last one?

 Or in mathematical words: How many possible combinations for $1 \le i_1 \le ... \le i_k \le n $? This week's problem was inspired by a ...